Assessment of BMDM-sEVs from RA animals
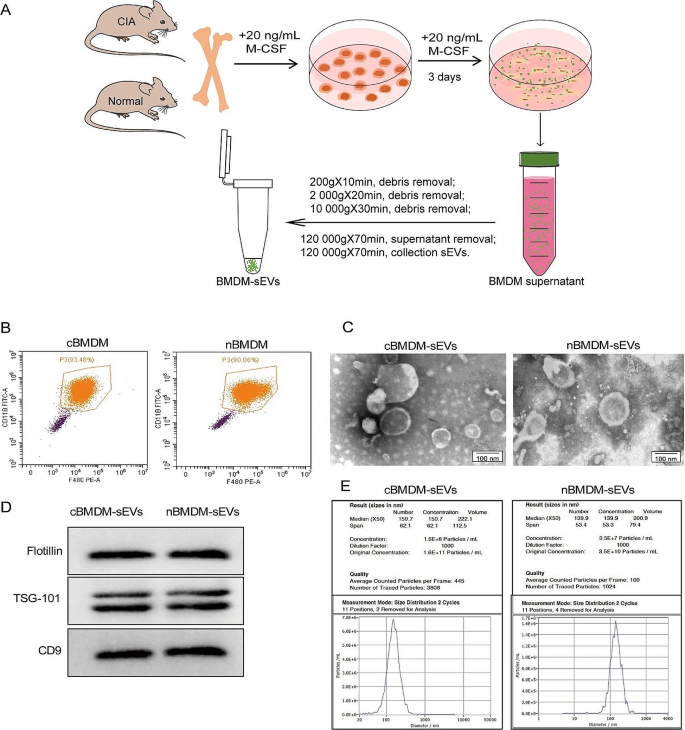
First, we extracted bone marrow cells from both the collagen-induced arthritis (CIA) model and normal mice, followed by in vitro differentiation into bone marrow derived macrophage (BMDM) (Fig. 1A). The BMDM population was characterized using flow cytometry (Fig. 1B), showing that approximately 90% of the cells exhibited positive expression of F4/80 and CD11b, confirming their macrophage phenotype. Subsequently, transmission electron microscopy (TEM) analysis showed that the obtained BMDM-derived sEVs (BMDM-sEVs) possessed the characteristic bilayer lipid membrane structure and an average size of approximately 150 nm (Fig. 1C). Western blot (WB) analysis confirmed the presence of specific sEV markers, including TSG-101, Flotillin, and CD9 (Fig. 1D). Nanoparticle tracking analysis (NTA) further substantiated that the size of sEVs in both groups was around 150 nm, while the number of sEVs secreted from CIA mice derived-BMDM-sEVs (cBMDM-sEVs) was approximately three times higher compared with those from normal mice derived BMDM-sEVs (nBMDM-sEVs) (Fig. 1E). These results collectively validate the successful isolation of BMDM-sEVs from both the CIA and normal groups, indicating that cBMDM exhibit an enhanced capacity for sEV secretion compared with nBMDM with an equivalent number of macrophages.
Identification of BMDMs and their sEVs. (A) Extraction process of BMDM-sEVs. (B) BMDMs surface makers F4/80 and CD11b analyzed by flow cytometry. (C) Morphology of sEVs determined by TEM. (D) sEVs surface markers Flotillin, TSG101, and CD9 examined by WB. (E) Diameter and concentration of sEVs examined by NTA
cBMDM-sEVs effectively stimulate the proliferation and inflammation of RA-FLS
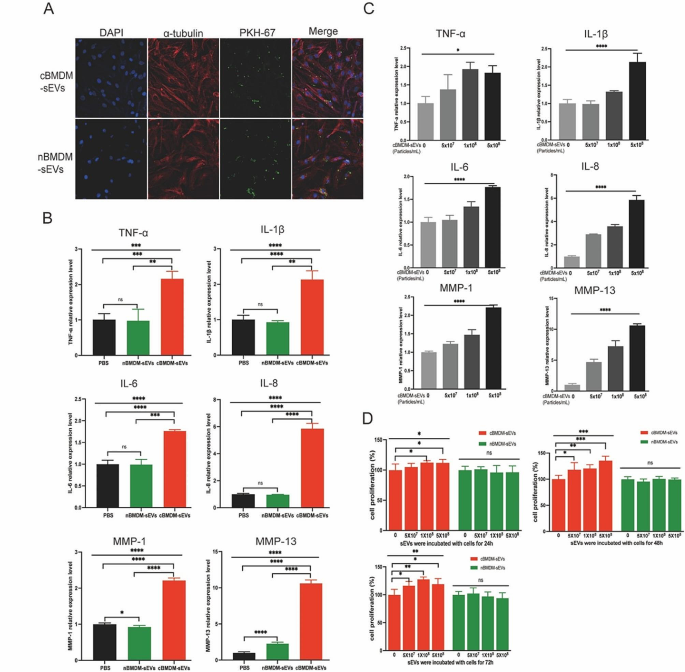
Next, we investigated the impact of BMDM-sEVs from different sources on RA-FLS, with a primary focus on elucidating whether these sEVs could effectively penetrate the FLS. Thus, both cBMDM-sEVs and nBMDM-sEVs were labeled with PKH67 and co-cultured with RA-FLS for 12 h. Results showed that both types of sEVs were successfully internalized into the cytoplasm of RA-FLS, with no evidence of nuclear entry (Fig. 2A). Subsequently, cBMDM-sEVs (5 × 10⁸ particles/mL), nBMDM-sEVs (5 × 10⁸ particles/mL), and equal volumes of phosphate buffer saline (PBS) were separately co-cultured with RA-FLS for 24 h, and the levels of inflammatory factors as well as members of the matrix metalloproteinases (MMPs) family were assessed. Remarkably, cBMDM-sEVs elicited a significant increase in the expression of TNF-α, IL-1β, IL-6, IL-8, MMP-1, and MMP-13 compared with nBMDM-sEVs and the PBS control (Fig. 2B and S1), but the expression of MMP-3 and MMP-9 was no significant difference among three groups. Notably, the expression levels of these factors (except MMP-3 and MMP-9) demonstrated a positive correlation with the concentration of cBMDM-sEVs when different concentrations were co-cultured with RA-FLS (Fig. 2C and S2). Moreover, RA-FLS co-cultured with various concentrations of cBMDM-sEVs and nBMDM-sEVs were examined for cell proliferation after 24, 48, and 72 h (Fig. 2D). Results showed that cBMDM-sEVs prominently stimulated the proliferation of RA-FLS when compared to both the PBS control and the nBMDM-sEVs group. Collectively, these findings provide compelling evidence that cBMDM-sEVs play a crucial role in promoting the proliferation and inflammation of RA-FLS.
Effects of cBMDM-sEVs on proliferation and inflammation of RA-FLS in vitro. (A) BMDM-sEVs internalized by RA-FLS. (B) mRNA level of inflammatory cytokines in RA-FLS co-cultured with PBS, cBMDM-sEVs, or nBMDM-sEVs, as determined by qRT-PCR. (C) mRNA level of inflammatory cytokines in RA-FLS co-cultured with gradient concentration of cBMDM-sEVs. (D) Proliferation of RA-FLS co-cultured with PBS, cBMDM-sEVs, or nBMDM-sEVs, as determined by CCK8. Data are presented as mean ± SD, *p < 0.05, **p < 0.01, ***p < 0.001, ****p < 0.0001
cBMDM-sEVs exacerbated arthritis in RA animals
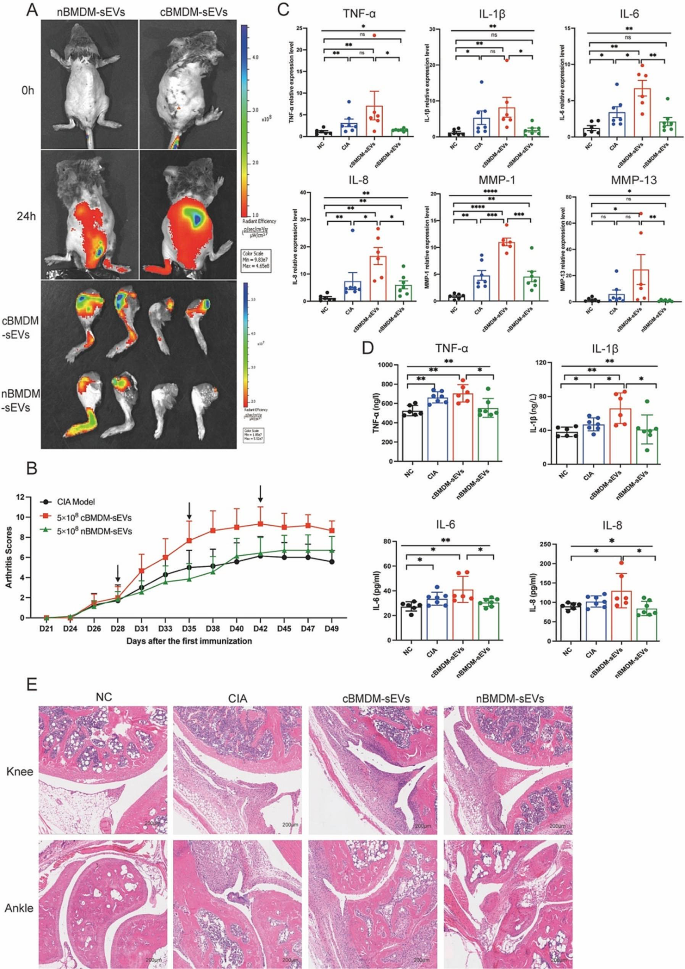
The involvement of EVs in cell-to-cell communication and their ability to traverse distant tissues via bodily fluid circulation have been widely documented [23,24,25]. To elucidate the potential role of BMDM-sEVs in the context of CIA mice, we labeled cBMDM-sEVs and nBMDM-sEVs with DiR and administered them to CIA mice intravenously. Results showed that both cBMDM-sEVs and nBMDM-sEVs were observed to effectively reach the inflamed joints after 24 h, signifying their ability to access the inflammatory site via circulation in the body fluids (Fig. 3A). Next, we examined the impact of cBMDM-sEVs and nBMDM-sEVs on the CIA models. Notably, weekly injections of cBMDM-sEVs (5 × 10⁸ particles) via the tail vein resulted in a rapid aggravation of inflammation. In contrast, mice receiving an equivalent amount of nBMDM-sEVs did not exhibit aggravated inflammation at the early stage (Fig. 3B). While with prolonged injection accumulation, nBMDM-sEVs also contributed to increased inflammation, albeit to a lesser extent than that caused by cBMDM-sEVs. In addition, when cBMDM-sEVs and nBMDM-sEVs were injected at a lower dose (5 × 10⁷ particles), no significant differences in joint inflammation were observed among the three groups (Figure S3).
Furthermore, quantitative real-time PCR (qRT-PCR) analysis of ankle joint tissue revealed dramatically higher mRNA levels of TNF-α, IL-1β, IL-6, IL-8, MMP-1, and MMP-13 in the cBMDM-sEVs group compared with the PBS and nBMDM-sEVs groups (Fig. 3C). ELISA analysis of serum further confirmed these findings, demonstrating significant elevations in the levels of TNF-α, IL-1β, IL-6, and IL-8 in the cBMDM-sEVs group compared with NC and nBMDM-sEVs group. However, it’s important to note that only IL-1β exhibited a significant increase in the cBMDM-sEVs group when compared with the CIA group (Fig. 3D). Finally, histological examination of knee and ankle joints using hematoxylin and eosin staining (H&E) revealed more severe synovial hyperplasia, pannus formation, inflammatory cell infiltration, and bone erosion in the cBMDM-sEVs group compared with the PBS and nBMDM-sEVs groups. All these results suggest that BMDM-sEVs, particularly those derived from CIA mice, play a pivotal role in exacerbating arthritis in the CIA mouse model.
cBMDM-sEVs aggravated arthritis in CIA models. (A) cBMDM-sEVs and nBMDM-sEVs labeled with DiR, and fluorescence images obtained at 0 and 24 h after intravenous injection of the DIR-labeled BMDM-sEVs into CIA mice. (B) Arthritis score in three groups. (C) mRNA expression of TNF-α, IL-1β, IL-6, IL-8, MMP-1, and MMP-13 in ankle joint of four groups. (D) Levels of TNF-α, IL-1β, IL-6, and IL-8 in serum of four groups. (E) H&E staining of knee and ankle joints in CIA mice. Each group consists of 6–7 mice. Data are presented as mean ± SD, *p < 0.05, **p < 0.01, ***p < 0.001, ****p < 0.0001
Identification of differentially expressed miRNAs in cBMDM-sEVs and nBMDM-sEVs
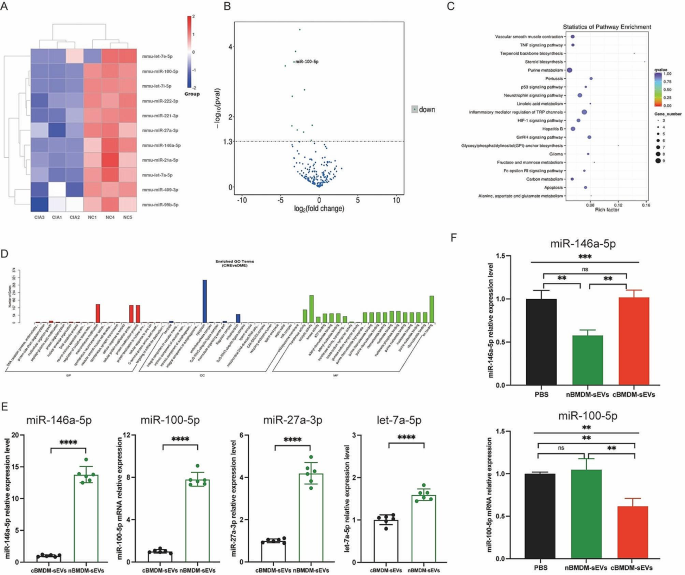
To better understand the potential mechanisms underlying the selective transport of miRNAs, we embarked on an analysis of miRNA profiles in BMDM-sEVs derived from CIA and normal mice. Strikingly, a subset of miRNAs, including miR-146a-5p, miR-100-5p, miR-27a-3p, let-7a-5p, miR-21a-5p, miR-99b-5p, let-7e-5p, miR-222-3p, miR-409-3p, let-7i-5p, and miR-221-3p, exhibited significant downregulation in cBMDM-sEVs when compared with nBMDM-sEVs (Fig. 4A-D). Interestingly, our analysis exclusively identified miRNAs with reduced expression in cBMDM-sEVs, with no miRNAs displaying upregulated expression. To validate the differential miRNA expression in cBMDM-sEVs and nBMDM-sEVs, we performed qRT-PCR analysis on selected miRNAs (miR-146a-5p, miR-100-5p, miR-27a-3p, and let-7a-5p) extracted from cBMDM-sEVs and nBMDM-sEVs. Results showed higher expression levels of these selected miRNAs in cBMDM-sEVs compared with nBMDM-sEVs, albeit with some variation (Fig. 4E). Among these miRNAs, miR-146a-5p and miR-100-5p displayed distinct expression patterns between the cBMDM-sEVs and nBMDM-sEVs, and were selected for further investigations.
Next, we asked whether BMDMs from distinct sources transferred varying miRNA levels to RA-FLS via sEVs, thereby influencing the biological function of RA-FLS. We found that the expression of miR-146a-5p in RA-FLS co-cultured with nBMDM-sEVs was notably lower than that in RA-FLS co-cultured with cBMDM-sEVs or PBS (Fig. 4F). In contrast, the expression of miR-100-5p in RA-FLS co-cultured with cBMDM-sEVs exhibited a significant reduction compared with the PBS and nBMDM-sEVs co-culture groups. These results underscore the potential of cBMDM to promote RA-FLS proliferation and inflammation by releasing sEVs with diminished miR-100-5p levels, while miR-146a-5p does not seem to play a comparable role in this context.
Expression of miRNA in cBMDM-sEVs and nBMDM-sEVs. (A) Heatmap analysis of miRNA in cBMDM-sEVs and nBMDM-sEVs (n = 3). (B) Volcano plot of differentially expressed miRNA between cBMDM-sEVs and nBMDM-sEVs. (C) KEGG pathway analyses of differentially expressed miRNA between cBMDM-sEVs and nBMDM-sEVs. (D) GO analyses of differentially expressed miRNA between cBMDM-sEVs and nBMDM-sEVs. (E) mRNA expression of miR-146a-5p, miR-100-5p, miR-27a-3p, and let-7a-5p in cBMDM-sEVs and nBMDM-sEVs by qRT-PCR. (F) mRNA expression of miR-146a-5p and miR-100-5p in RA-FLS co-cultured with PBS, cBMDM-sEVs or nBMDM-sEVs, respectively. Data are presented as mean ± SD, *p < 0.05, **p < 0.01, ***p < 0.001, ****p < 0.0001
Suppression of proliferation and inflammation of RA-FLS via miR-100-5p
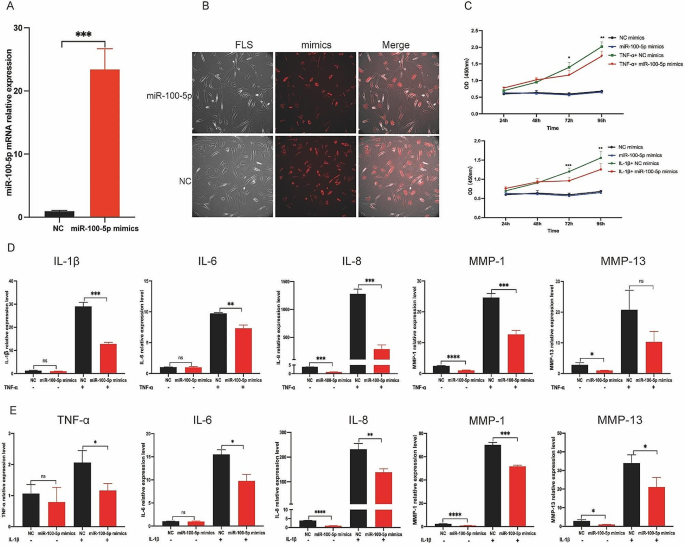
To elucidate the impact of miR-100-5p on RA-FLS, we conducted transfection experiments using miR-100-5p mimics, negative control (NC) mimics, miR-100-5p inhibitors, or NC inhibitors in RA-FLS, and verified the transfection efficiencies through qRT-PCR and immunofluorescence (IF) analyses (Fig. 5A and B, and Figure S4). The influence of miR-100-5p overexpression on RA-FLS proliferation was investigated under the stimulation of either 10 ng/mL IL-1β or 25 ng/ mL TNF-α. Notably, examination at various time points (24, 48, 72, and 96 h) revealed that miR-100-5p exerted inhibitory effects on RA-FLS proliferation under the stimulation of IL-1β or TNF-α, particularly evident at 72- and 96-hour post-stimulation (Fig. 5C).
Then we analyzed the relative expressions of inflammatory factors (IL-1β, IL-6, IL-8, MMP-1, and MMP-13) in FLS transfected with miR-100-5p mimics or inhibitors under TNF-α or IL-1β stimulation conditions. Intriguingly, qRT-PCR analysis demonstrated a significant decrease in the relative expressions of IL-1β, IL-6, IL-8, MMP-1, and MMP-13 in RA-FLS transfected with miR-100-5p mimics under TNF-α stimulation (Fig. 5D). Conversely, the relative expressions of TNF-α, IL-6, IL-8, MMP-1, and MMP-13 were markedly increased in RA-FLS transfected with miR-100-5p inhibitors (Figure S5). Similarly, upon IL-1β stimulation, miR-100-5p mimic transfection led to suppression of TNF-α, IL-6, IL-8, MMP-1, and MMP-13 expressions (Fig. 5E), while miR-100-5p inhibitor transfection resulted in their upregulation (Figure S6). These observations confirm that miR-100-5p overexpression effectively inhibits the inflammatory response of RA-FLS stimulated by IL-1β or TNF-α, whereas low miR-100-5p expression promotes their inflammatory response and proliferation. Thus, our findings highlight the crucial role of miR-100-5p in regulating RA-FLS behavior in response to pro-inflammatory cytokines.
Effect of miR-100-5p on inflammation and proliferation of RA-FLS. (A) mRNA expression of miR-100-5p in RA-FLS transfected with NC mimics or miR-100-5p mimics analyzed by qRT-PCR. (B) Images of RA-FLS transfected with NC mimics-cy3 or miR-100-5p mimics-cy3. (C) Proliferation of RA-FLS transfected with NC or miR-100-5p mimics and stimulated with or without 10 ng/mL IL-1β or 25 ng/mL TNF-α at 24, 48, 72, and 96 h by CCK8. (D) mRNA expression of IL-1β, IL-6, IL-8, MMP-1, and MMP-13 in RA-FLS transfected with NC or miR-100-5p mimics and stimulated with or without 25 ng/mL TNF-α. (E) mRNA expression of TNF-α, IL-6, IL-8, MMP-1, and MMP-13 in RA-FLS transfected with NC or miR-100-5p mimics and stimulated with or without 10 ng/mL IL-1β. Data are presented as mean ± SD, *p < 0.05, **p < 0.01, ***p < 0.001, ****p < 0.0001
Attenuation of arthritis in RA animals by miR-100-5p agomiR treatment
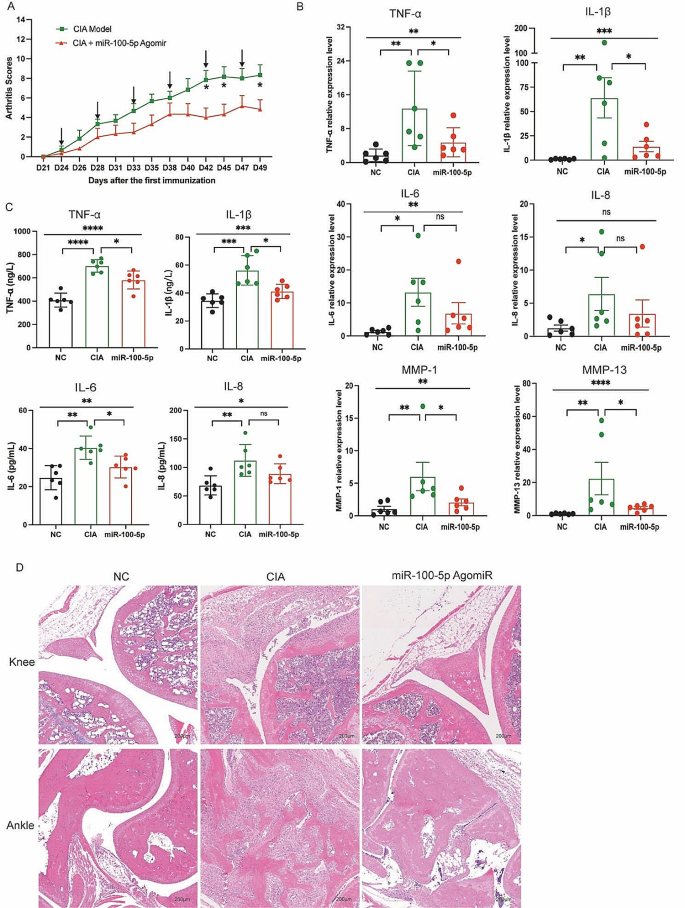
Building upon the above findings in vitro, we administered miR-100-5p agomiR, a chemically modified miR-100-5p agonist, into CIA mice through tail vein injection. Subsequent evaluation of arthritis progression revealed a notable reduction in the arthritis score in the miR-100-5p agomiR-treated group compared to the PBS-treated group (Fig. 6A). Moreover, analysis of mRNA relative expressions demonstrated a partial decrease in TNF-α, IL-1β, IL-6, IL-8, MMP-1, and MMP-13 in the miR-100-5p agomiR-treated CIA mice (Fig. 6B).
Additionally, the levels of TNF-α, IL-1β, IL-6, and IL-8 in the serum exhibited a partial reduction relative to the PBS-treated group (Fig. 6C). Histological examination of knee and ankle joint tissues further corroborated these findings, with HE staining revealing amelioration of synovial hyperplasia, pannus formation, inflammatory cell infiltration, and bone erosion in the miR-100-5p agomiR-treated group compared to the PBS group (Fig. 6D). Altogether, these results demonstrate the therapeutic potential of miR-100-5p agomiR in alleviating arthritis severity in CIA mice, further reinforcing the importance of miR-100-5p as a promising target for potential therapeutic interventions in rheumatoid arthritis.
miR-100-5p attenuation arthritis of CIA mice. (A) Arthritis score in two groups. (B) mRNA expression of TNF-α, IL-1β, IL-6, IL-8, MMP-1, and MMP-13 in ankle joint of three groups. (C) Levels of TNF-α, IL-1β, IL-6, and IL-8 in serum of three groups. (D) H&E staining of knee and ankle joints of CIA and normal control mice. Data are presented as mean ± SD, *p < 0.05, **p < 0.01, ***p < 0.001, ****p < 0.0001
The impact of miR-100-5p on rheumatoid arthritis via mTOR signaling
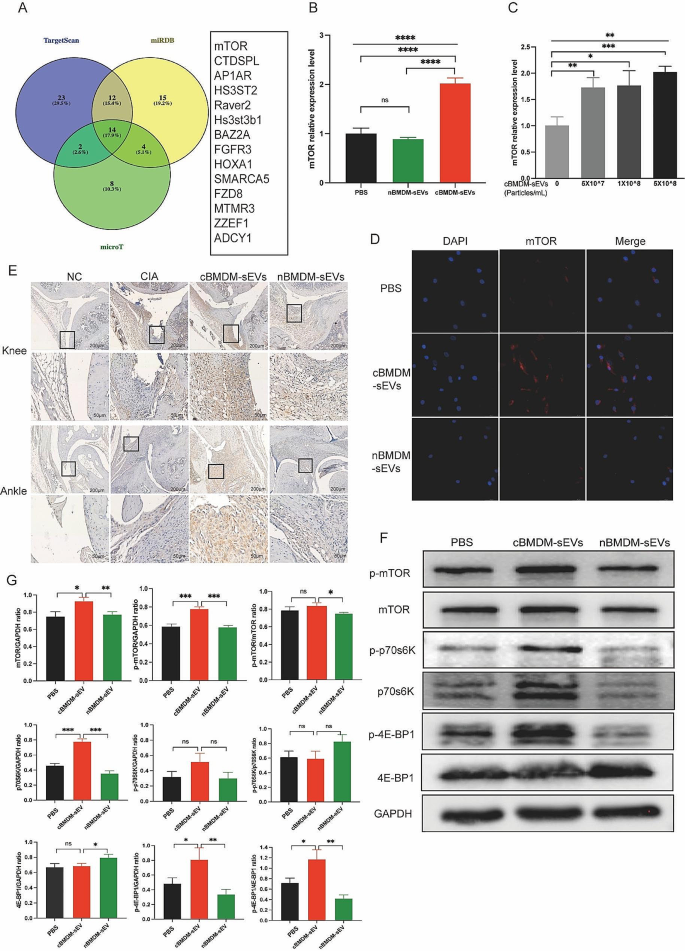
To elucidate the mechanisms by which miR-100-5p regulating the proliferation and inflammation of synovial cells, we employed TargetScan, miRDB, and microT bioinformatics platforms, and revealed mTOR as a potential target of miR-100-5p (Fig. 7A). Previous studies have already confirmed the binding of miR-100-5p to the 3’-UTR region of mTOR through double-luciferase reporter gene experiments [26,27,28,29,30], obviating the need for repeating this experiment. We assessed mTOR expression in RA-FLS co-cultured with distinct BMDM-sEVs at the mRNA (Fig. 7B), protein (Fig. 7F and G) and localization levels (Fig. 7D). We found that mTOR expression in RA-FLS co-cultured with cBMDM-sEVs was significantly higher compared to those co-cultured with nBMDM-sEVs and PBS. Furthermore, upon addition of various concentrations of cBMDM-sEVs, RA-FLS exhibited elevated mRNA expression of mTOR in contrast to the PBS group (p < 0.01) (Fig. 7C). Nevertheless, no significant correlation was observed between the mRNA expression levels of mTOR and the concentration gradient of cBMDM-sEVs.
Effect of cBMDM-sEVs on proliferation and inflammation of synovium in vivo and in vitro by targeting mTOR and downstream signal pathway. (A) Venn diagram of the targeting genes of miR-100-5p predicted by TargetScan, miRDB, and microT. (B) mRNA expression of mTOR in RA-FLS cocultured with PBS, cBMDM-sEVs or nBMDM-sEVs, respectively. (C) mRNA expression of mTOR in RA-FLS cocultured with different concentrations of cBMDM-sEVs. (D) Representative fluorescence images of mTOR in RA-FLS cocultured with PBS, cBMDM-sEVs or nBMDM-sEVs. (E) mTOR expression in knee and ankle joints analyzed by IHC. (F–G) Protein expression of mTOR, p-mTOR, p70s6K, p-p70s6K, 4E-BP1, and p-4E-BP1 by WB. Data are presented as mean ± SD, *p < 0.05, **p < 0.01, ***p < 0.001, ****p < 0.0001
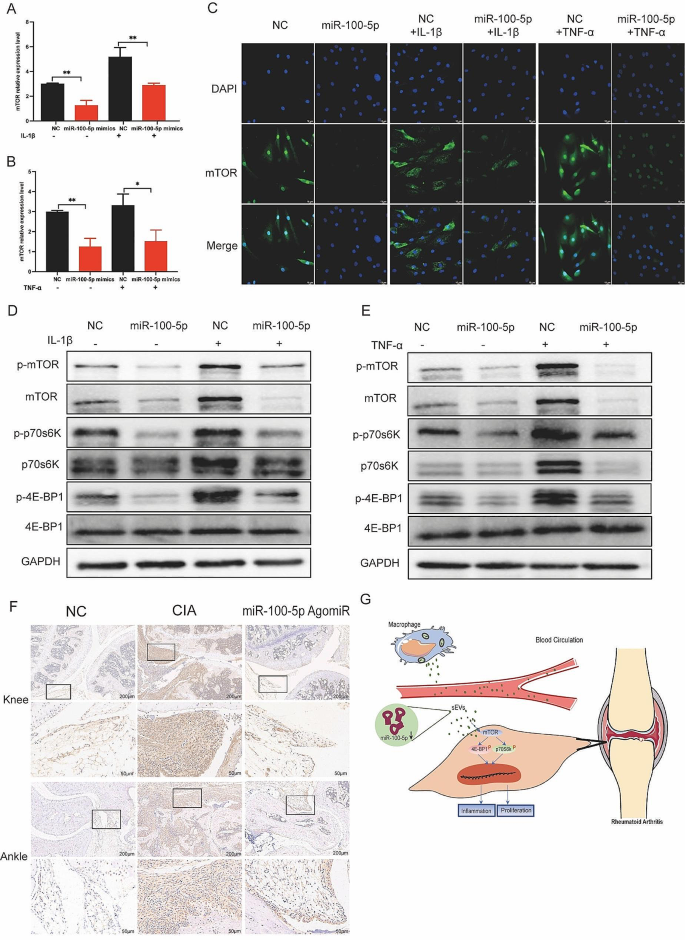
Upon transfection of miR-100-5p mimics or inhibitors, we evaluated the expression of mTOR at both the mRNA and protein levels. Our results indicated that miR-100-5p mimics reduced mTOR expression (Fig. 8A-C), whereas miR-100-5p inhibitors increased it (Figure S7). All these data support the notion that miR-100-5p is a regulator of mTOR expression. Next, we examined mTOR’s downstream targets p70 ribosomal protein S6 kinase (p70s6K) and 4E-Binding protein 1(4E-BP1). Combining the results with Kyoto encyclopedia of genes and genomes (KEGG) pathway analysis, we hypothesized that mTOR influences the proliferation and inflammatory response of cells through the regulation of downstream p70s6K and 4E-BP1 activation and protein expression. To test this hypothesis, we assessed the expression of p70s6K, p-p70s6K, 4E-BP1, and p-4E-BP1 in RA-FLS co-cultured with BMDM-sEVs from different sources (Fig. 7F) and in RA-FLS transfected with miR-100-5p mimics or inhibitors (Fig. 8D and E).
Moreover, in vivo analyses demonstrated higher mTOR expression in the cBMDM-sEV group (Fig. 7E). Additionally, the expression of mTOR in the knee and ankle joints of CIA mice injected with miR-100-5p agomiR was assessed, showing significantly reduced mTOR expression in the joints of CIA mice treated with miR-100-5p agomiR (Fig. 8F). All these results underscore the significance of miR-100-5p regulating mTOR signaling in RA pathogenesis.
Effect of miR-100-5p on proliferation and inflammation of synovium in vivo and in vitro by inhibiting mTOR and downstream signal pathway. (A–C) Expression of mTOR in RA-FLS transfected with NC or miR-100-5p mimics and stimulated with TNF-α or IL-1β. (D–E) Protein expression of mTOR/p70s6K/4E-BP1 signal pathway by Western blot. (F) mTOR expression in knee and ankle joints by IHC. (G) Proposed model explaining how cBMDM-sEVs with low miR-100-5p levels promote synovitis via targeting mTOR signaling
Partial rescue of inflammatory effects of cBMDM-sEVs by miR-100-5p overexpression
To further investigate whether the inflammatory expression of RA-FLS induced by cBMDM-sEVs is associated with the downregulation of miR-100-5p in RA-FLS, we performed transfections of miR-100-5p mimics and NC mimics in RA-FLS. After 24 h, additional cBMDM-sEVs were introduced to the transfected FLS, followed by IL-1β or TNF-α stimulation, and cells were harvested after 24 h. qRT-PCR was conducted to assess the relative expression of TNF-α, IL-1β, IL-6, IL-8, MMP-1, and MMP-13 at the mRNA level.
RA-FLS transfected with NC mimics showed significantly increased expression of TNF-α, IL-6, IL-8, MMP-1, and MMP-13, confirming the successful induction of IL-1β stimulation (Figure S8A-E). When cBMDM-sEVs were added to RA-FLS co-cultured with NC mimics, the expression of these factors in RA-FLS was markedly elevated (P < 0.05) (Figures S8A-E). Conversely, RA-FLS transfected with miR-100-5p mimics exhibited reduced expression of TNF-α, IL-6, IL-8, MMP-1, and MMP-13 compared to RA-FLS transfected with NC mimics (all P < 0.05) (Figure S8A-E). These results aligned with previous findings, confirming that the transfection procedure did not influence the inflammatory response of RA-FLS induced by cBMDM-sEVs.
Furthermore, when cBMDM-sEVs were added to the co-cultures of RA-FLS transfected with miR-100-5p mimics, increased expressions of TNF-α, IL-6, IL-8, MMP-1, and MMP-13 were observed, contrasting with the lower expressions observed in RA-FLS co-cultured with cBMDM-sEVs and transfected with NC mimics. Similar trends were observed with TNF-α stimulation, consistent with the results obtained from IL-1β stimulation (Figure S8F-J). These findings demonstrate that miR-100-5p can effectively reverse the inflammatory-promoting effect of certain cBMDM-sEVs on RA-FLS.

